IBM: A Case For Sam Palmisano firing Sam Palmisano
In this article we look at evidence that strongly suggests IBM (IBM), despite being turned into a cash “machine,” has done so not through its own R&D efforts, but rather through massive cost cutting. And its strategy is errily similar to that of Hewlett-Packard (HPQ), even prior to today’s announcement of a $1.7 billion acquisition, its second large announced deal over the past week.
In a highly publicized recent WSJ article, Mr. Palmisano, IBM’s CEO stated “H-P used to be a very inventive company.” The article states Mr. Hurd cut H-P’s research and development budget to $2.8 billion, or 2.5% of H-P’s revenue, in its last fiscal year from $3.5 billion, or 4% of revenue, in 2005, when he took over as CEO. Under Mr. Palmisano, the article states, IBM has continued to invest about 6% of its revenue in R&D, including $5.8 billion last year. As we show below, IBM had seen negative growth in revenues which distort the comparisons.
Instead, we present a case for: Sam Palmisano firing Sam Palmisano.
The point of our analysis is primarily related to the CEO’s comments, not a reflection of investment worth. In that regard, IBM is the more undervalued stock. We address the cash flows of both firms, as, in this industry, they are a function of superior R&D (product design).
Considering the strength of Mr. Palmisano’s comments, a review of both Hewlett-Packard (HPQ) and IBM are certainly in order, especially if his perceptions are widely held. If investors believed IBM has been producing increasing amounts of free cash flow as a result of a superior R&D effort-whether purchased or manufactured in-house-, then it is more likely its historic pattern will be repeated into future periods. If, on the other hand, IBM’s free cash flow is a result of other factors, including financial engineering, then its historic free cash flow growth rate may less likely be repeated, or may grow at a lower rate.
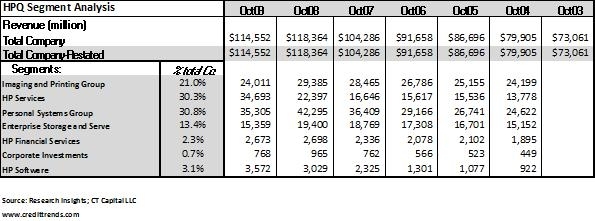
As CT Capital’s segment analysis below shows, almost 80% of IBM’s revenues are related to software and services. For HPQ, it is just 32.6%. As such, one would expect IBM to invest a greater percentage of its cash flows into R&D than HPQ. Given IBM’s increasing push into software and services –Tables 1 and 2 -it is surprising IBM has not invested a greater nominal amount into R&D, like Microsoft (MSFT) and Oracle (ORCL) (discussed below)-preferring to instead spend the bulk of its free cash flows on stock repurchases. This is why, despite the record setting free cash flow of its fiscal 2009, IBM’s cost of capital rose. Its stock price benefited since the rise in free cash flows offset the increase in uncertainty related to future results.
Over the period 2004-2009, IBM repurchased $55.2 billion of its stock compared to HPQ’s $40.4 billion. Including stock sales, HPQ repurchased a net $29.2 billion compared to IBM’s $48.3 billion.
Hewlett-Packard Segment Analysis 2004-2009
IBM Segment Analysis 2004-2009

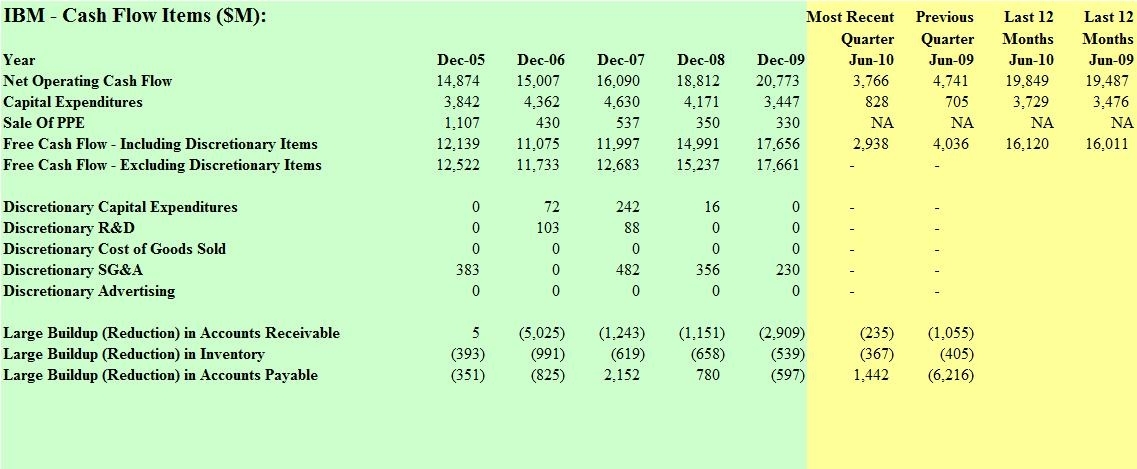
IBM Free Cash Flow
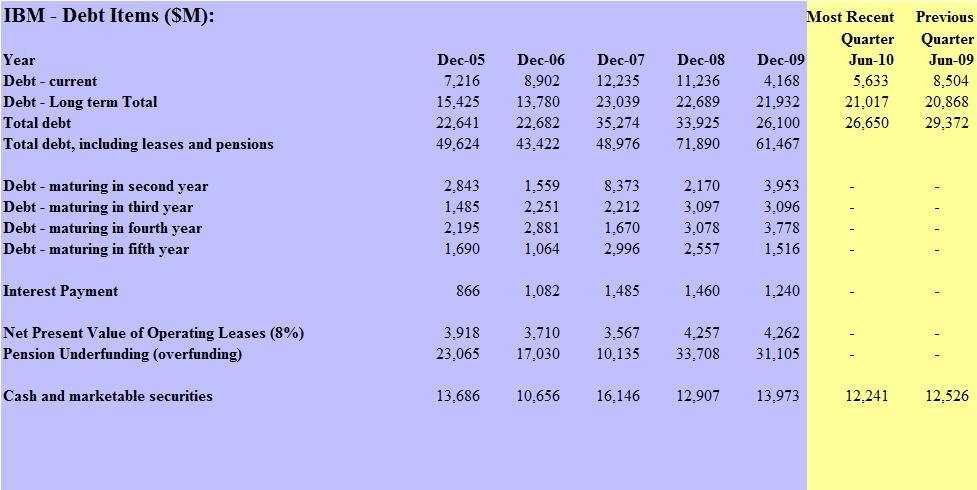
Over the same period, total debt, including leases and pensions, have grown from $49.6 billion to $61.5 billion, while shareholders equity has shrunk due to the buybacks. As long as IBM can consistently produce large free cash flows, investors will most likely look away from the decline in the equity base.
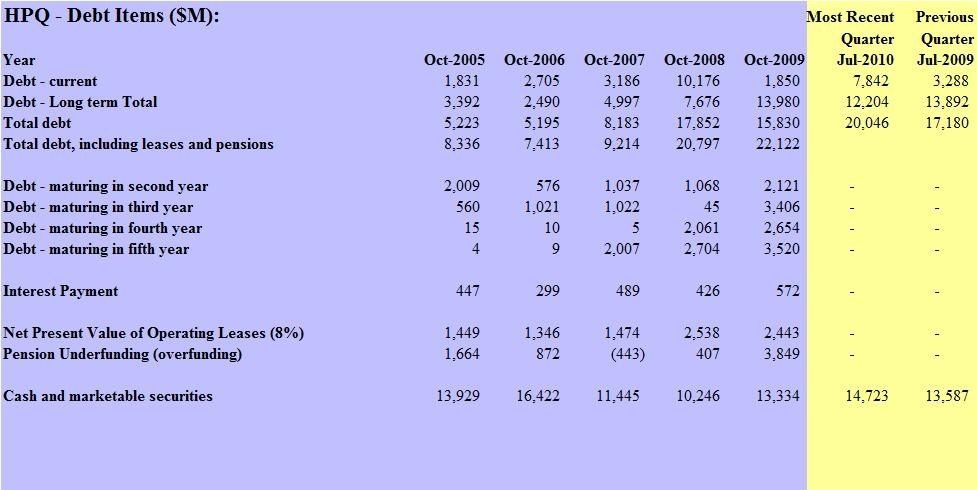
IBM Debt
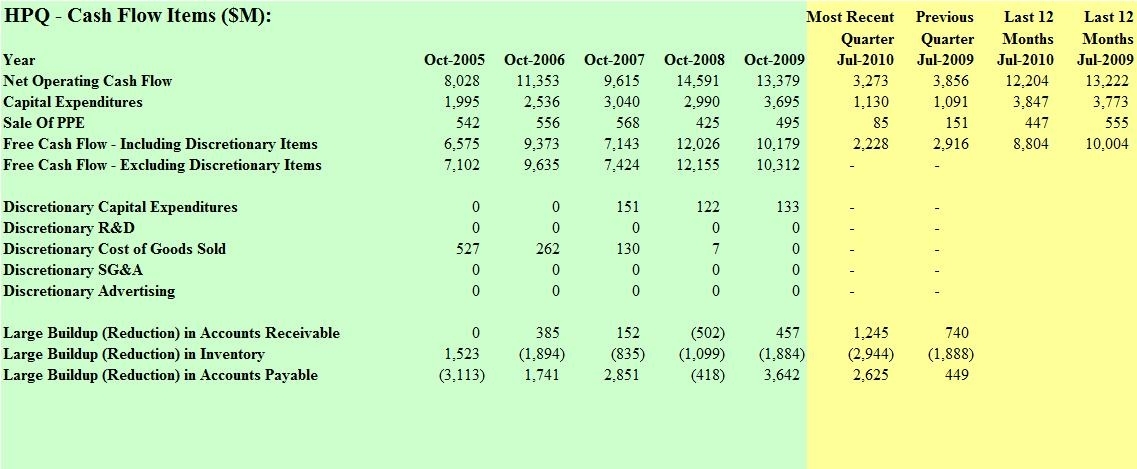
During the same period, HPQ has seen its free cash flow rise from $7.1 billion to $10.3 billion. The only area of excess for HPQ has been capital spending. Like IBM, its 10Ks and COGS lines reveal it has a very efficient supply chain which has been successful wringing out costs.
HPQ Free Cash Flow
Despite a 150% rise in total debt for HPQ, interest payments have risen just 27%. When adjusted for the cash tax rate, the after-tax-cost is just 15% higher over the past 5 years as HPQ’s cash tax rate has declined.
HPQ Debt
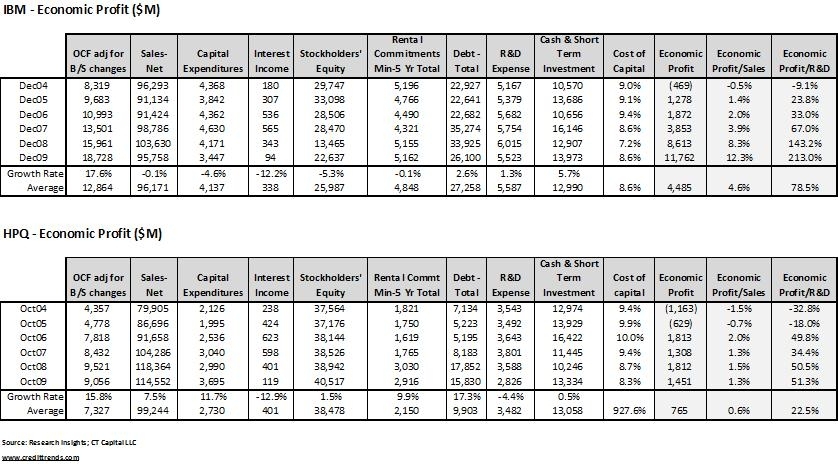
Economic profit is a valuable metric for firms which require limited capital to produce cash flows or rely on others capital for manufacture, such as outsourcing. I define economic profit as a company’s free cash flow exclusive of interest income minus a capital charge, with the charge calculated as the company’s weighted-average cost of capital multiplied by the operating invested capital. Thetraditional definition of economic profit uses after-tax operating profits in lieu offree cash flow. By CT Capital’s, IBM has shown marked improvement, as has HPQ. However, the bulk of its improvement has been thru excessive cost control, not thru new products related to R&D success.
Now, back to Mr. Palmisano’s comments. Over the past 5 years, capital spending, which is a residual function of R&D and product acceptance (including improvements to) has risen on average 11.7% per year at HPQ while at IBM it has declined. In fairness, the decline at IBM is related to its exit from the PC business.
By comparison, Oracle, one of the firms Mr. Palmisano said he considers a rival, has seen its R&D grow by 16.2% per year with 4.1% growth in capital spending. Microsoft’s five year capital spending grew by 19.5% per year and its R&D by 7.1% per year. But unlike IBM’s declining revenue, MSFT sales have grown by 9.4% per year and Oracle’s sales by 17.8%. Since Mr. Palmisano views Oracle and Microsoft as his true competitors, why is he allowing the wide “inventive” gap between them to continue?
Table 7 below shows IBM’s economic profit as a percentage of sales having benefitted by the decline in revenues, in essence painting a biased outcome for that metric.
IBM and HPQ – Various Financial Metrics Including Economic Profit
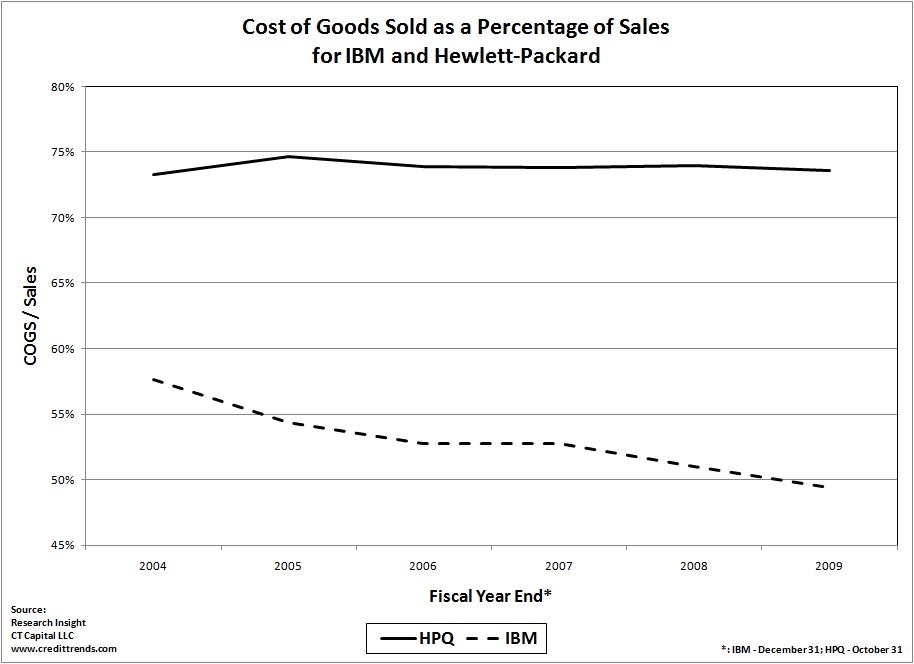
There is no denying IBM has been an extremely strong producer of free cash flows. It is, however, a tangible result of its shift into high margin businesses from low margin hardware, and a massive shift in its cost structure and balance sheet management.This is partially captured in its cost of sales (Figure 1), with this metric benefitting from the company’s large-scale move to India and other low cost geographies. By contrast, SG&A has risen for IBM over the same time period, however since COGS runs twice as large, its permanent decline has added approximately $3 billion per year in free cash flow. For HPQ, due its being manufacturing-centric, COGS runs 6 times as large as SG&A, diminishing the comparisons between these two firms, and thus Mr. Palmisano’s comments.
Cost of Goods Sold as a Percentage of Sales
While the common stock in IBM has outperformed that of HPQ over the past five years, it is a result of the recent increased risk at HPQ, as measured by cost of capital, which has risen from 8.3% at year’s end to its current 8.8%. Thus, investors are also demanding a higher return to make an investment in HPQ given recent happenings-it is not the result of its R&D effort.
HPQ’s rise in risk began with the departure of Mark Hurd, compounded by the announcement of a major share repurchase amounting to 15% of market value, and followed by almost $4 billion in announced business acquisitions having a very low cash based return on invested capital. The effect of these actions has been to increase uncertainty, reduce financial flexibility, resulting in a loss of expected improvement to return on invested capital (ROIC). Prior to the Hurd departure, stock in HPQ was outperforming IBM by almost 50% over the 5-year span.
Comparative Five-Year Stock Performance IBM and HPQ

The evidence strongly indicates the rise in free cash flow at IBM is not the result of its R&D efforts (Tables 7 and 8), leading us to question Mr. Palmisano’s harsh criticism of HPQ. If anything, IBM appears guilty of the same practices it accuses HPQ of during Hurd’s leadership.
So, why were those comments made, knowing it would stir up controversy? This is difficult to say, especially given IBM’s underinvestments. One could only surmise he smells blood after the controversial firing of Mr. Hurd, the 3Par acquisition, and fall in HPQ’s stock, while perhaps more concerned over HPQ’s obvious push into the fast growth storage business. He is also likely attempting to send a message to HPQ’s clients that management is shaky and not dedicated to innovative solutions. The latter is a difficult argument to buy in the context of HPQ’s most recent acquisitions which, from a financial sense, are value-destroying deals.
Given the results, one would expect IBM’s free cash flow growth will moderate in the years ahead. It is unlikely to be able to wring out anything but small supply chain savings, and given a resumption of economic activity, one would further expect its SG&A and COGS lines to reverse some of the past years improvement. It should also see an important rise in its cash tax rate.
Related articles:
- IBM – CEO Sam Palmisano Should Look at Facts First
- IBM – Again, Pension Underfunding a Leading Indicator
- CFOs Making the Same Mistake Again-Stock Buybacks
- The Folly of Stock Buybacks
- HPQ, Business Acquisitions, and Share Buybacks
- Use ROIC, Not EBITDA for Superior Performance
Disclosure: No positions
Kenneth S. Hackel, CFA
President
CT Capital LLC
Subscribe to CreditTrends.com by Email

If you are interested in learning more about cash flow, financial structure and valuation, order “Security Valuation and Risk Analysis” out this fall from McGraw-Hill.